Silvia Hell
1/5
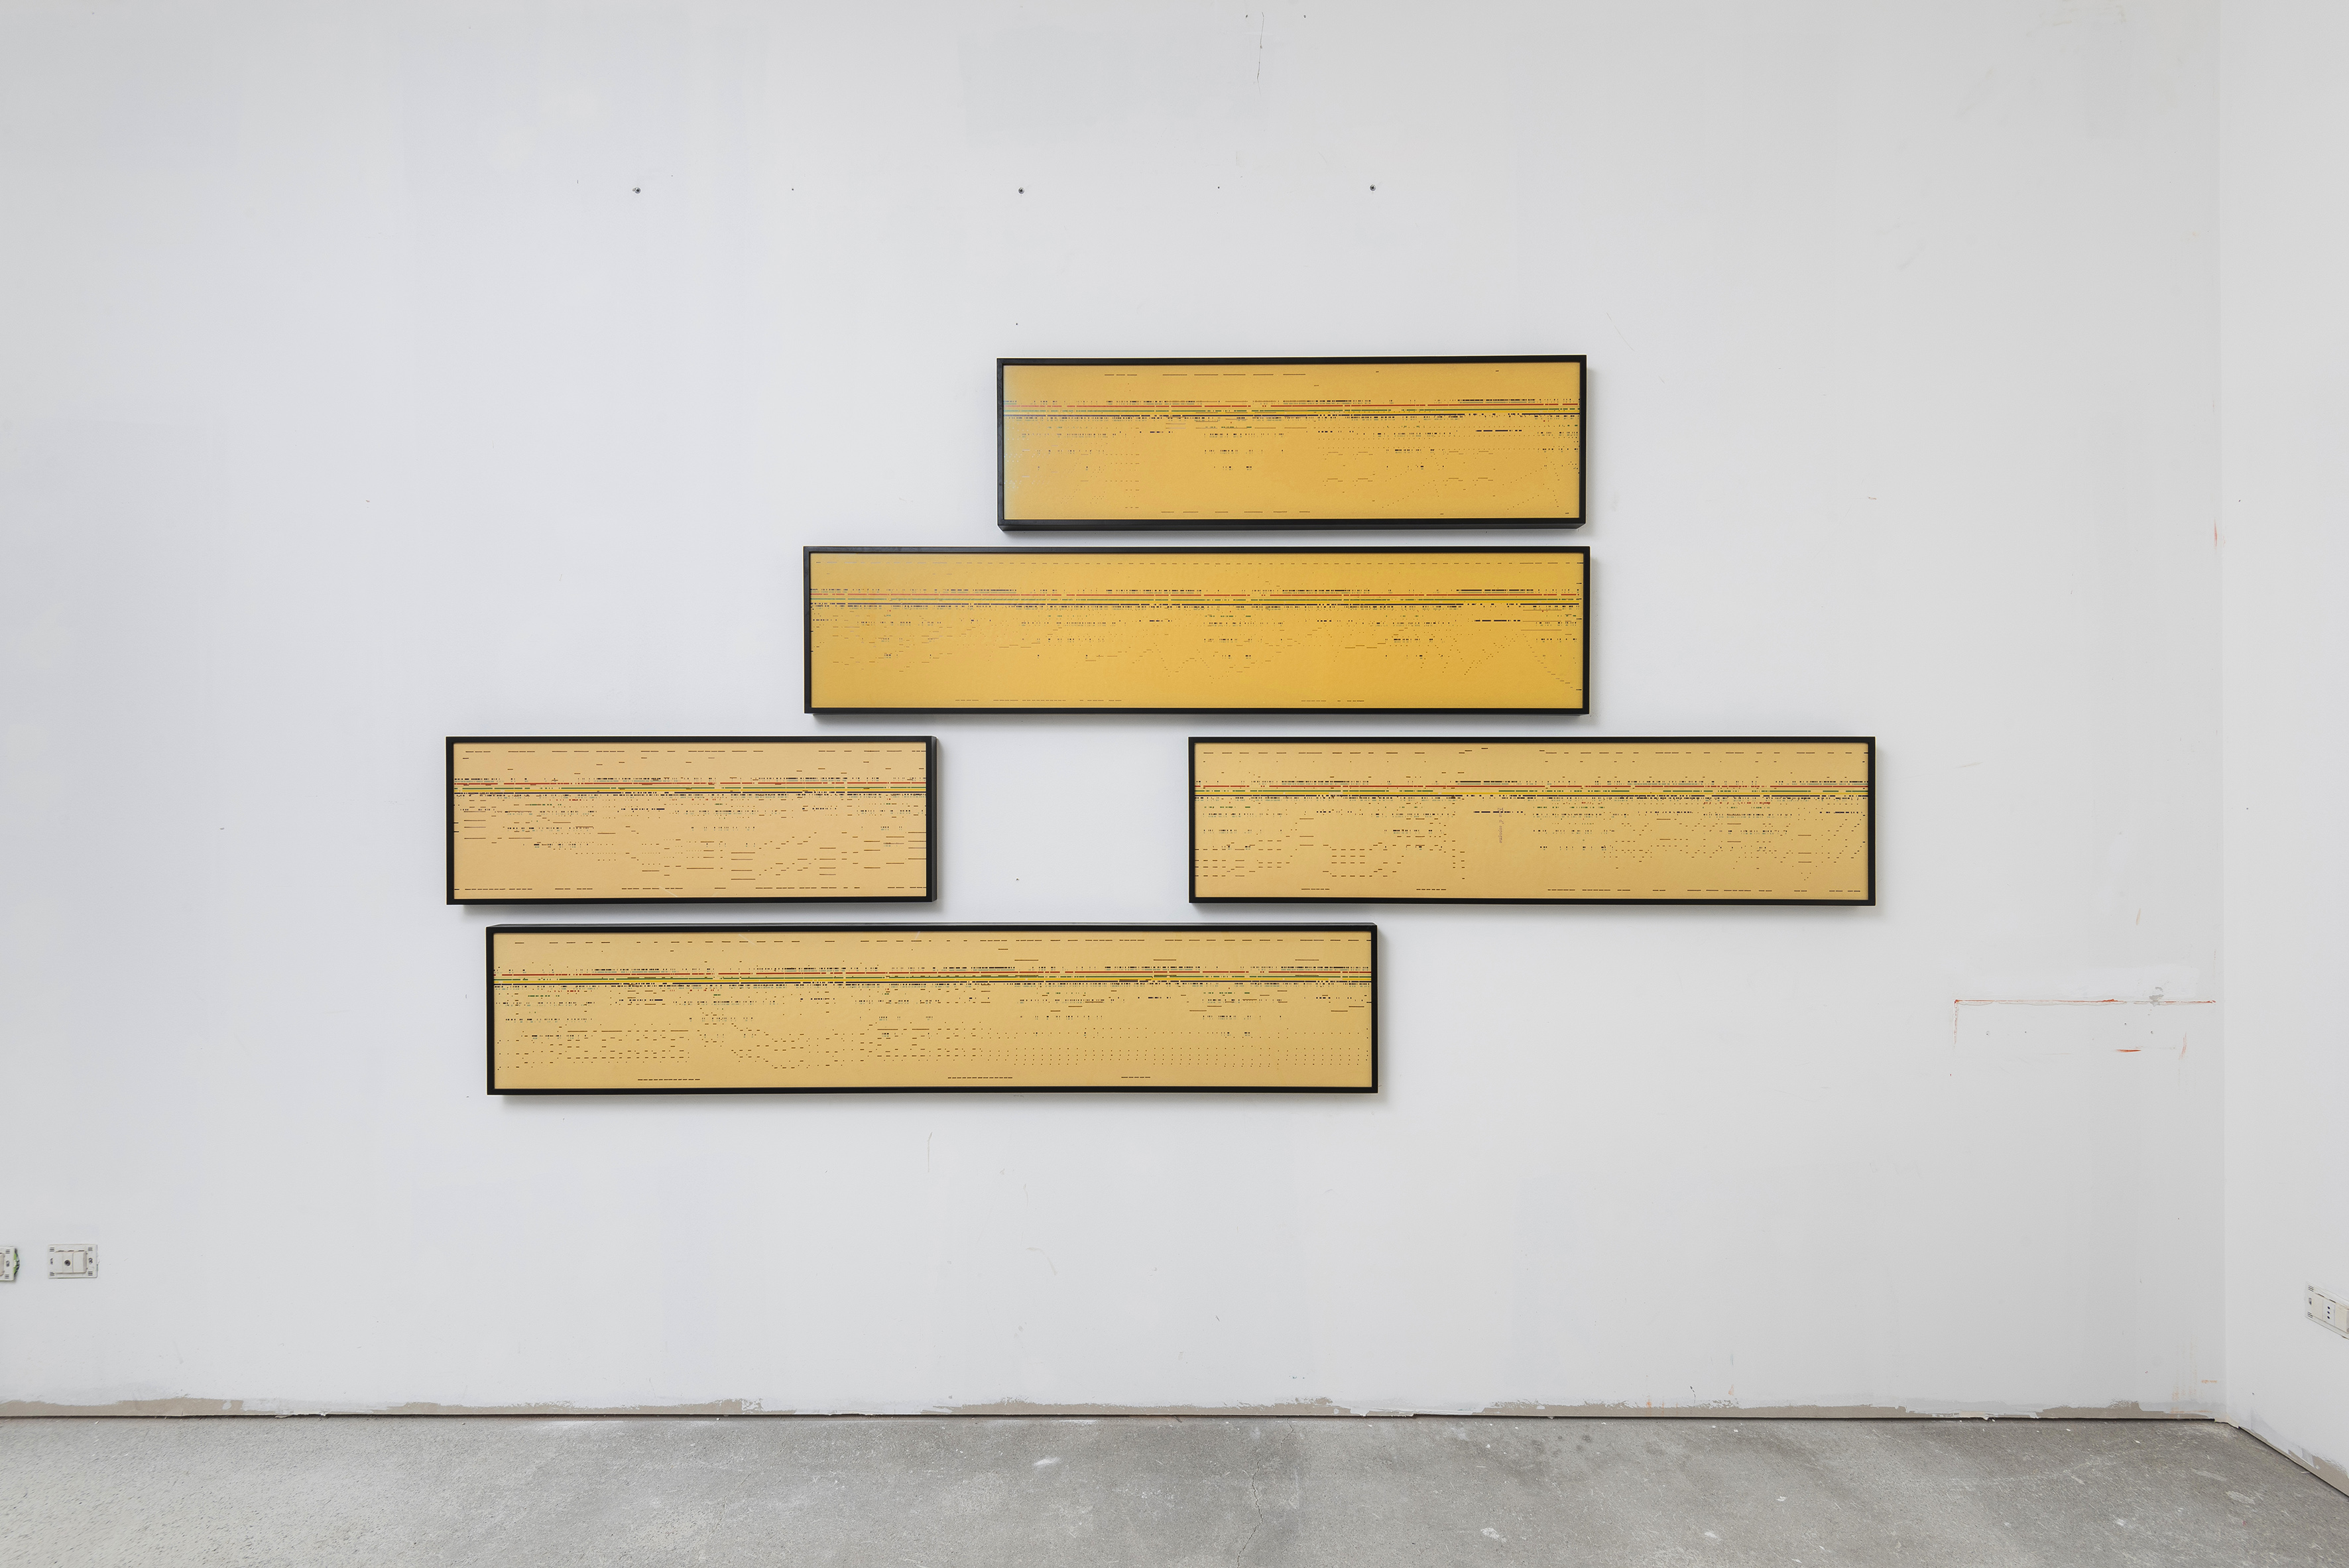
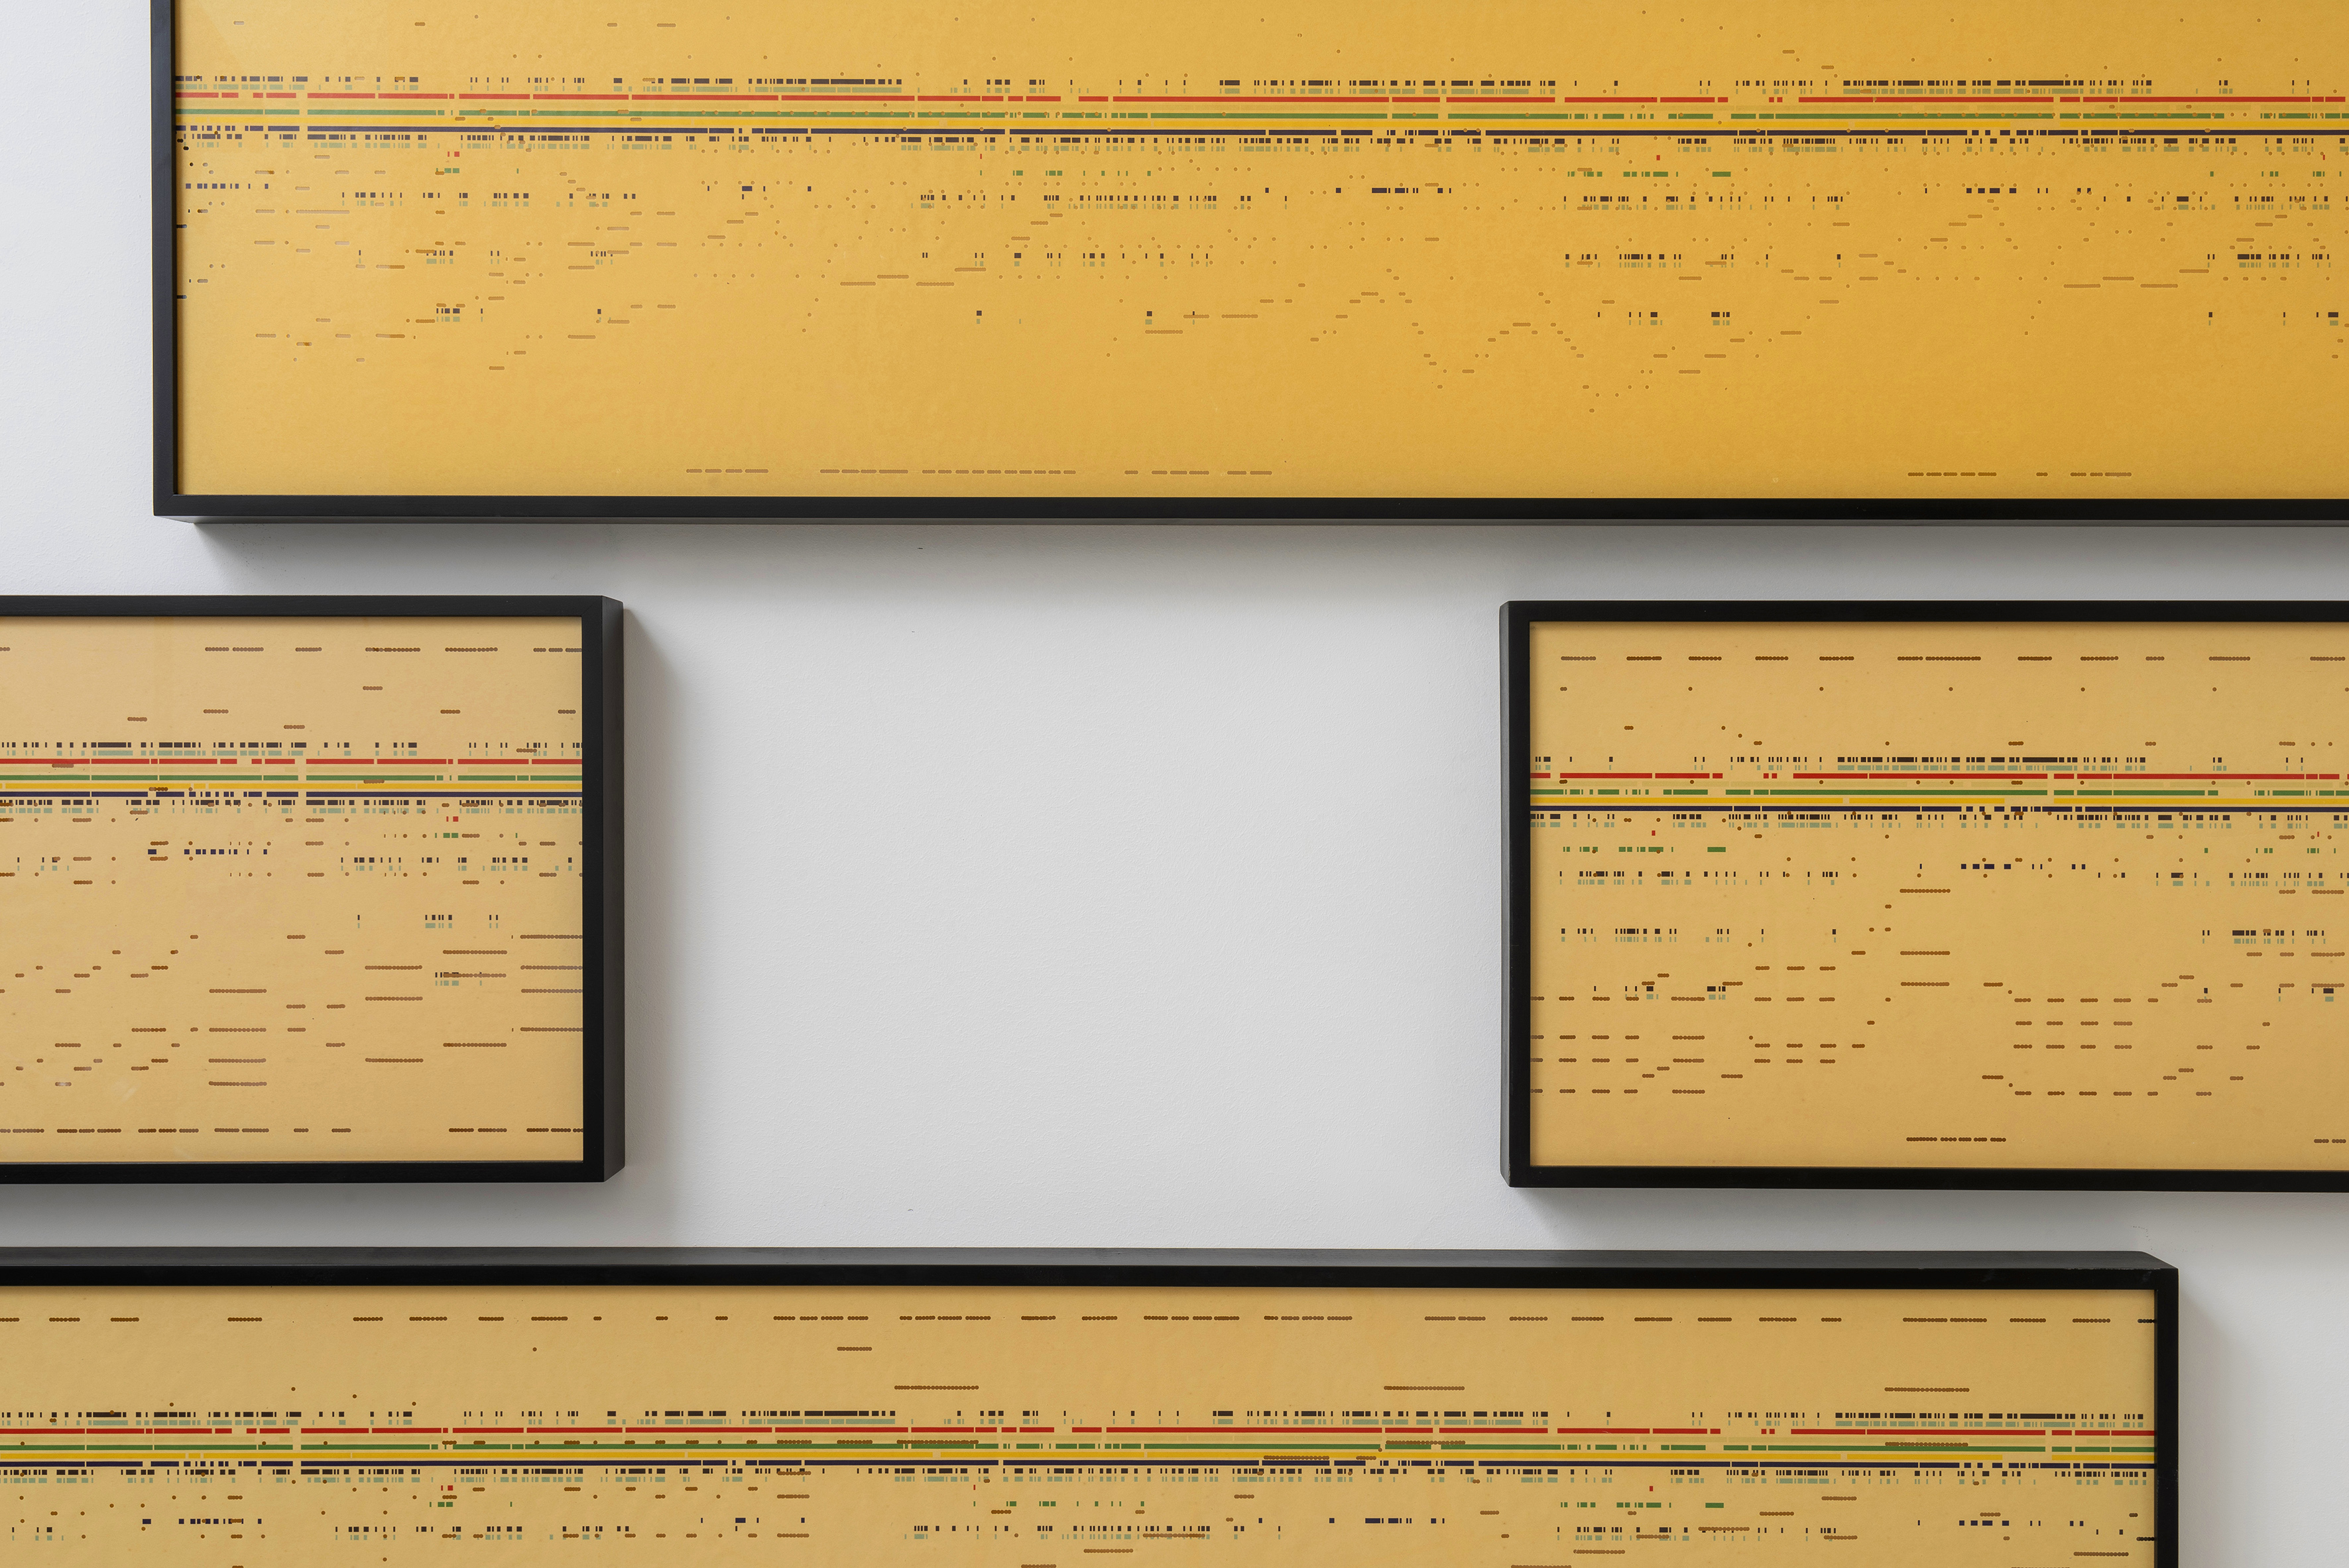
Silvia Hell – Air Milano Rossini – 2018 – UV flatbed print on piano roll, framed – Courtesy Gallery A B
2/5
Silvia Hell – Air Milano Rossini – 2018 – UV flatbed print on piano roll, framed – Courtesy Gallery A B
3/5
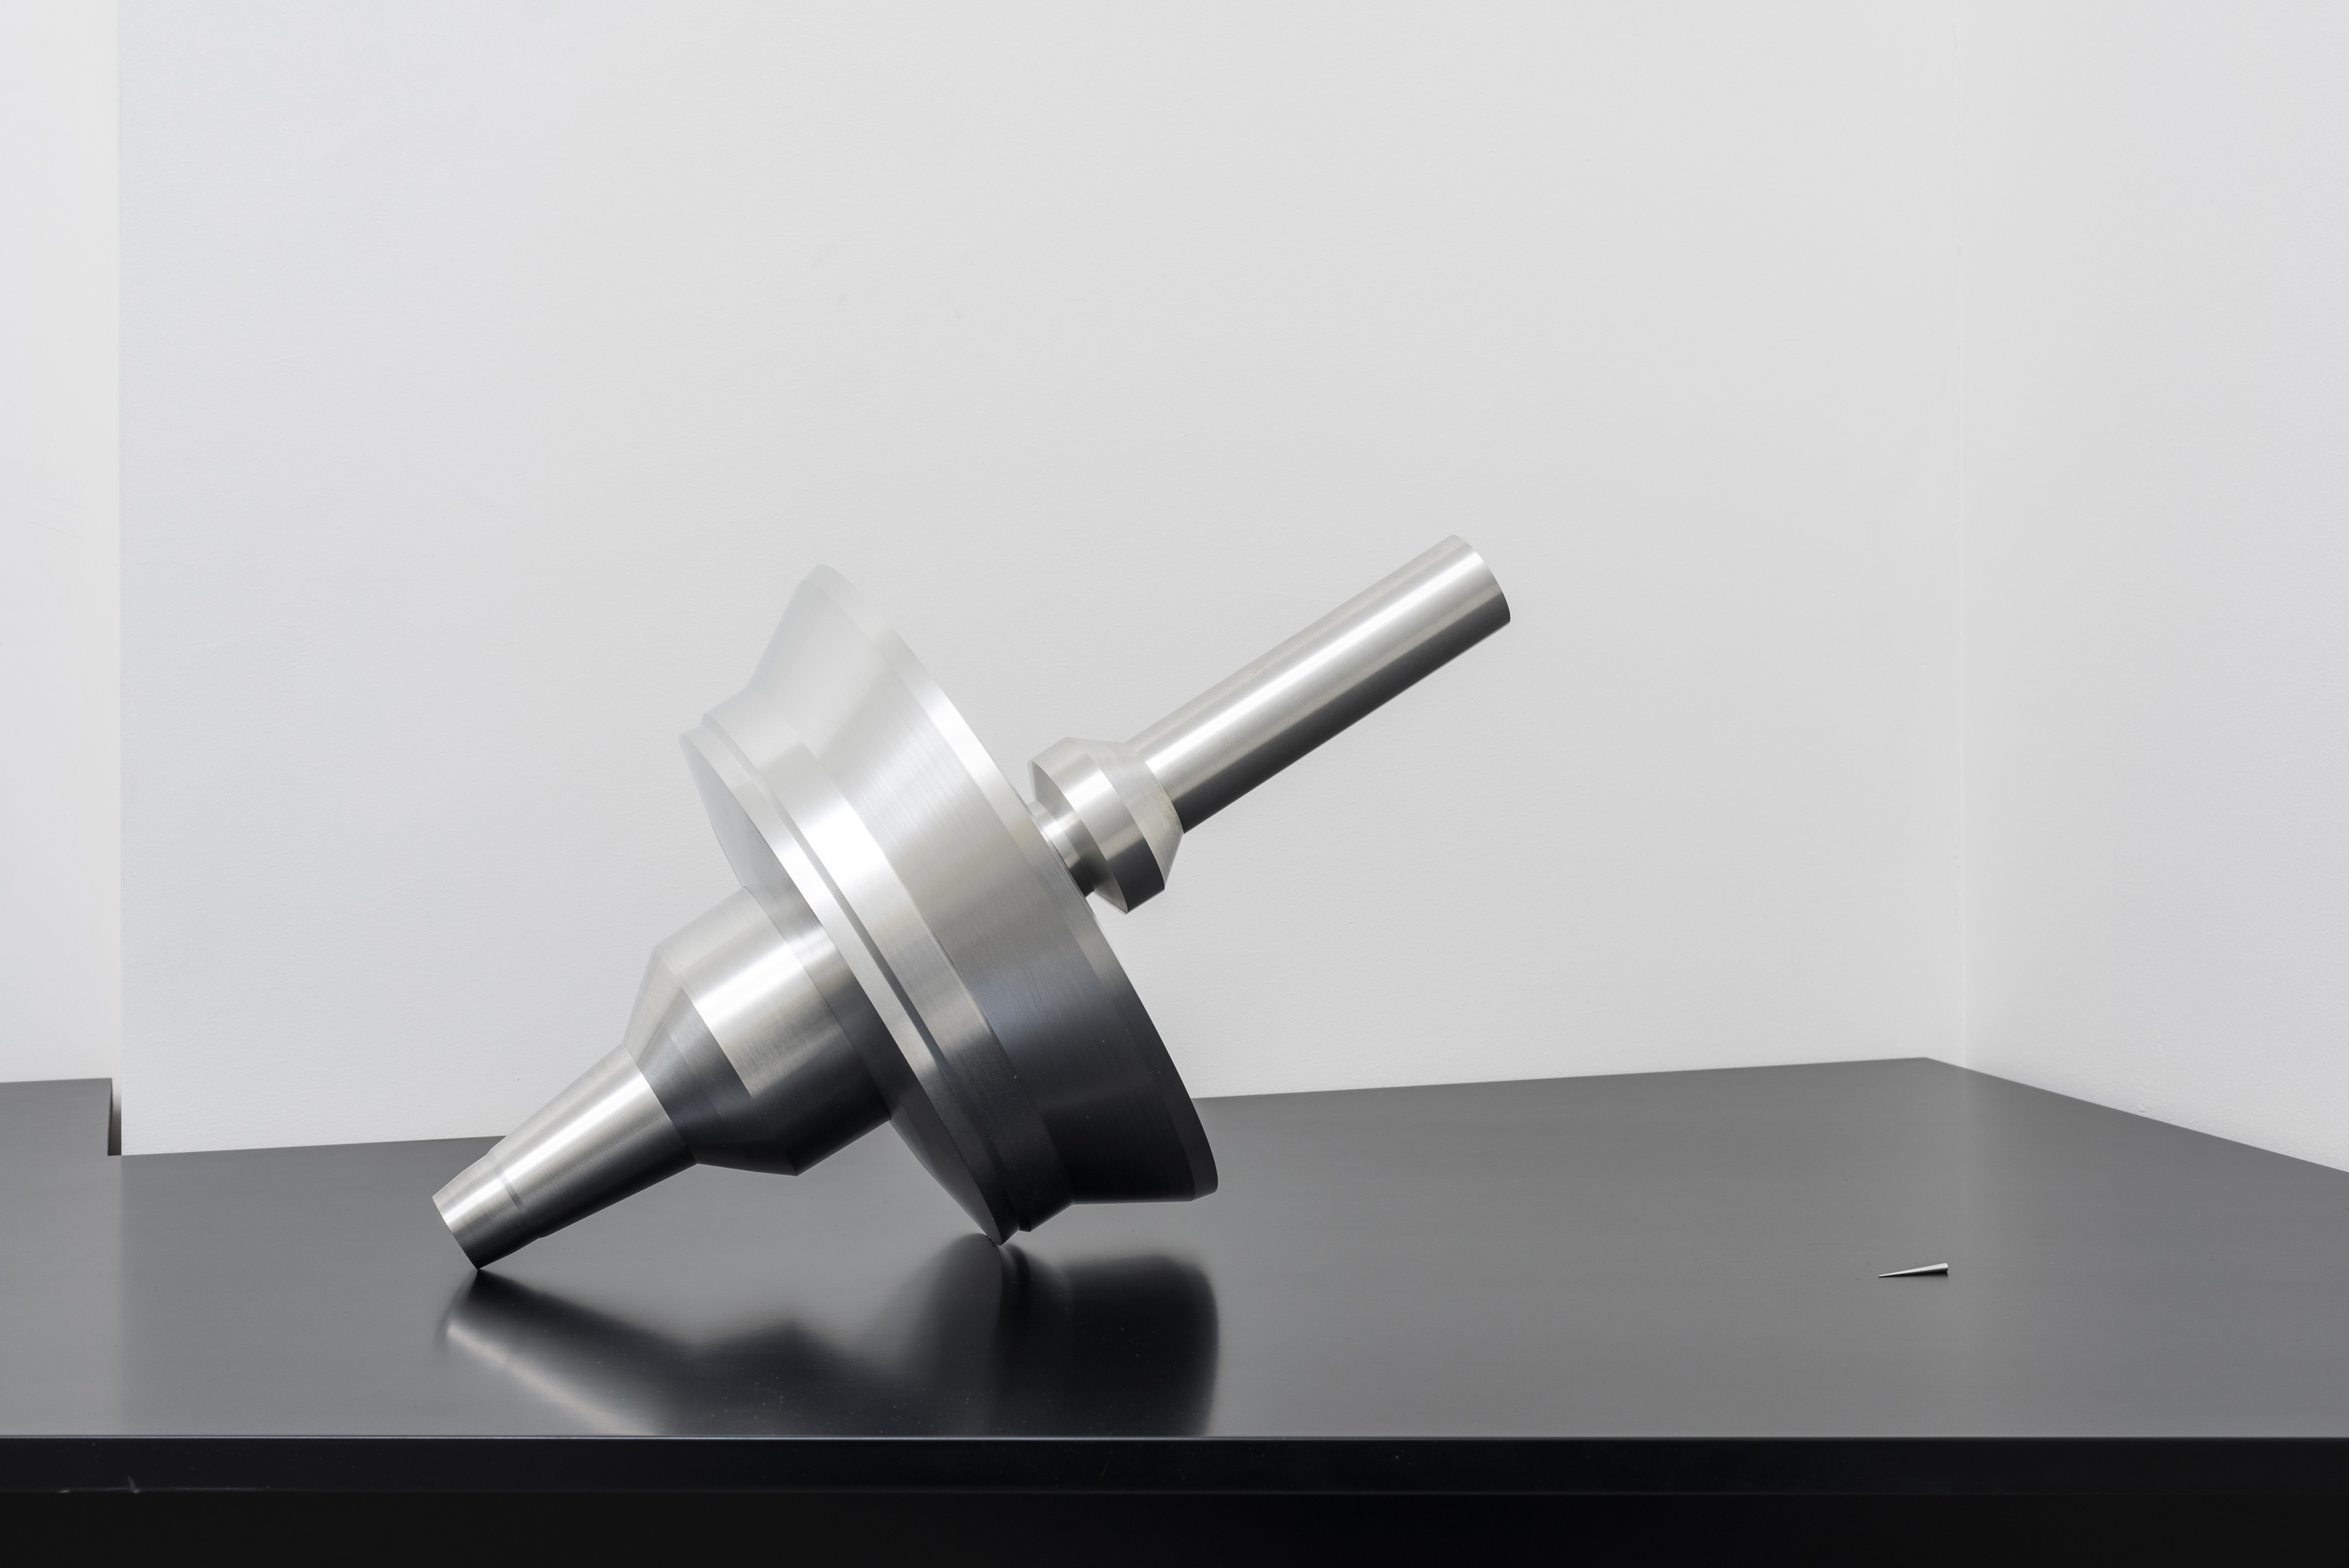
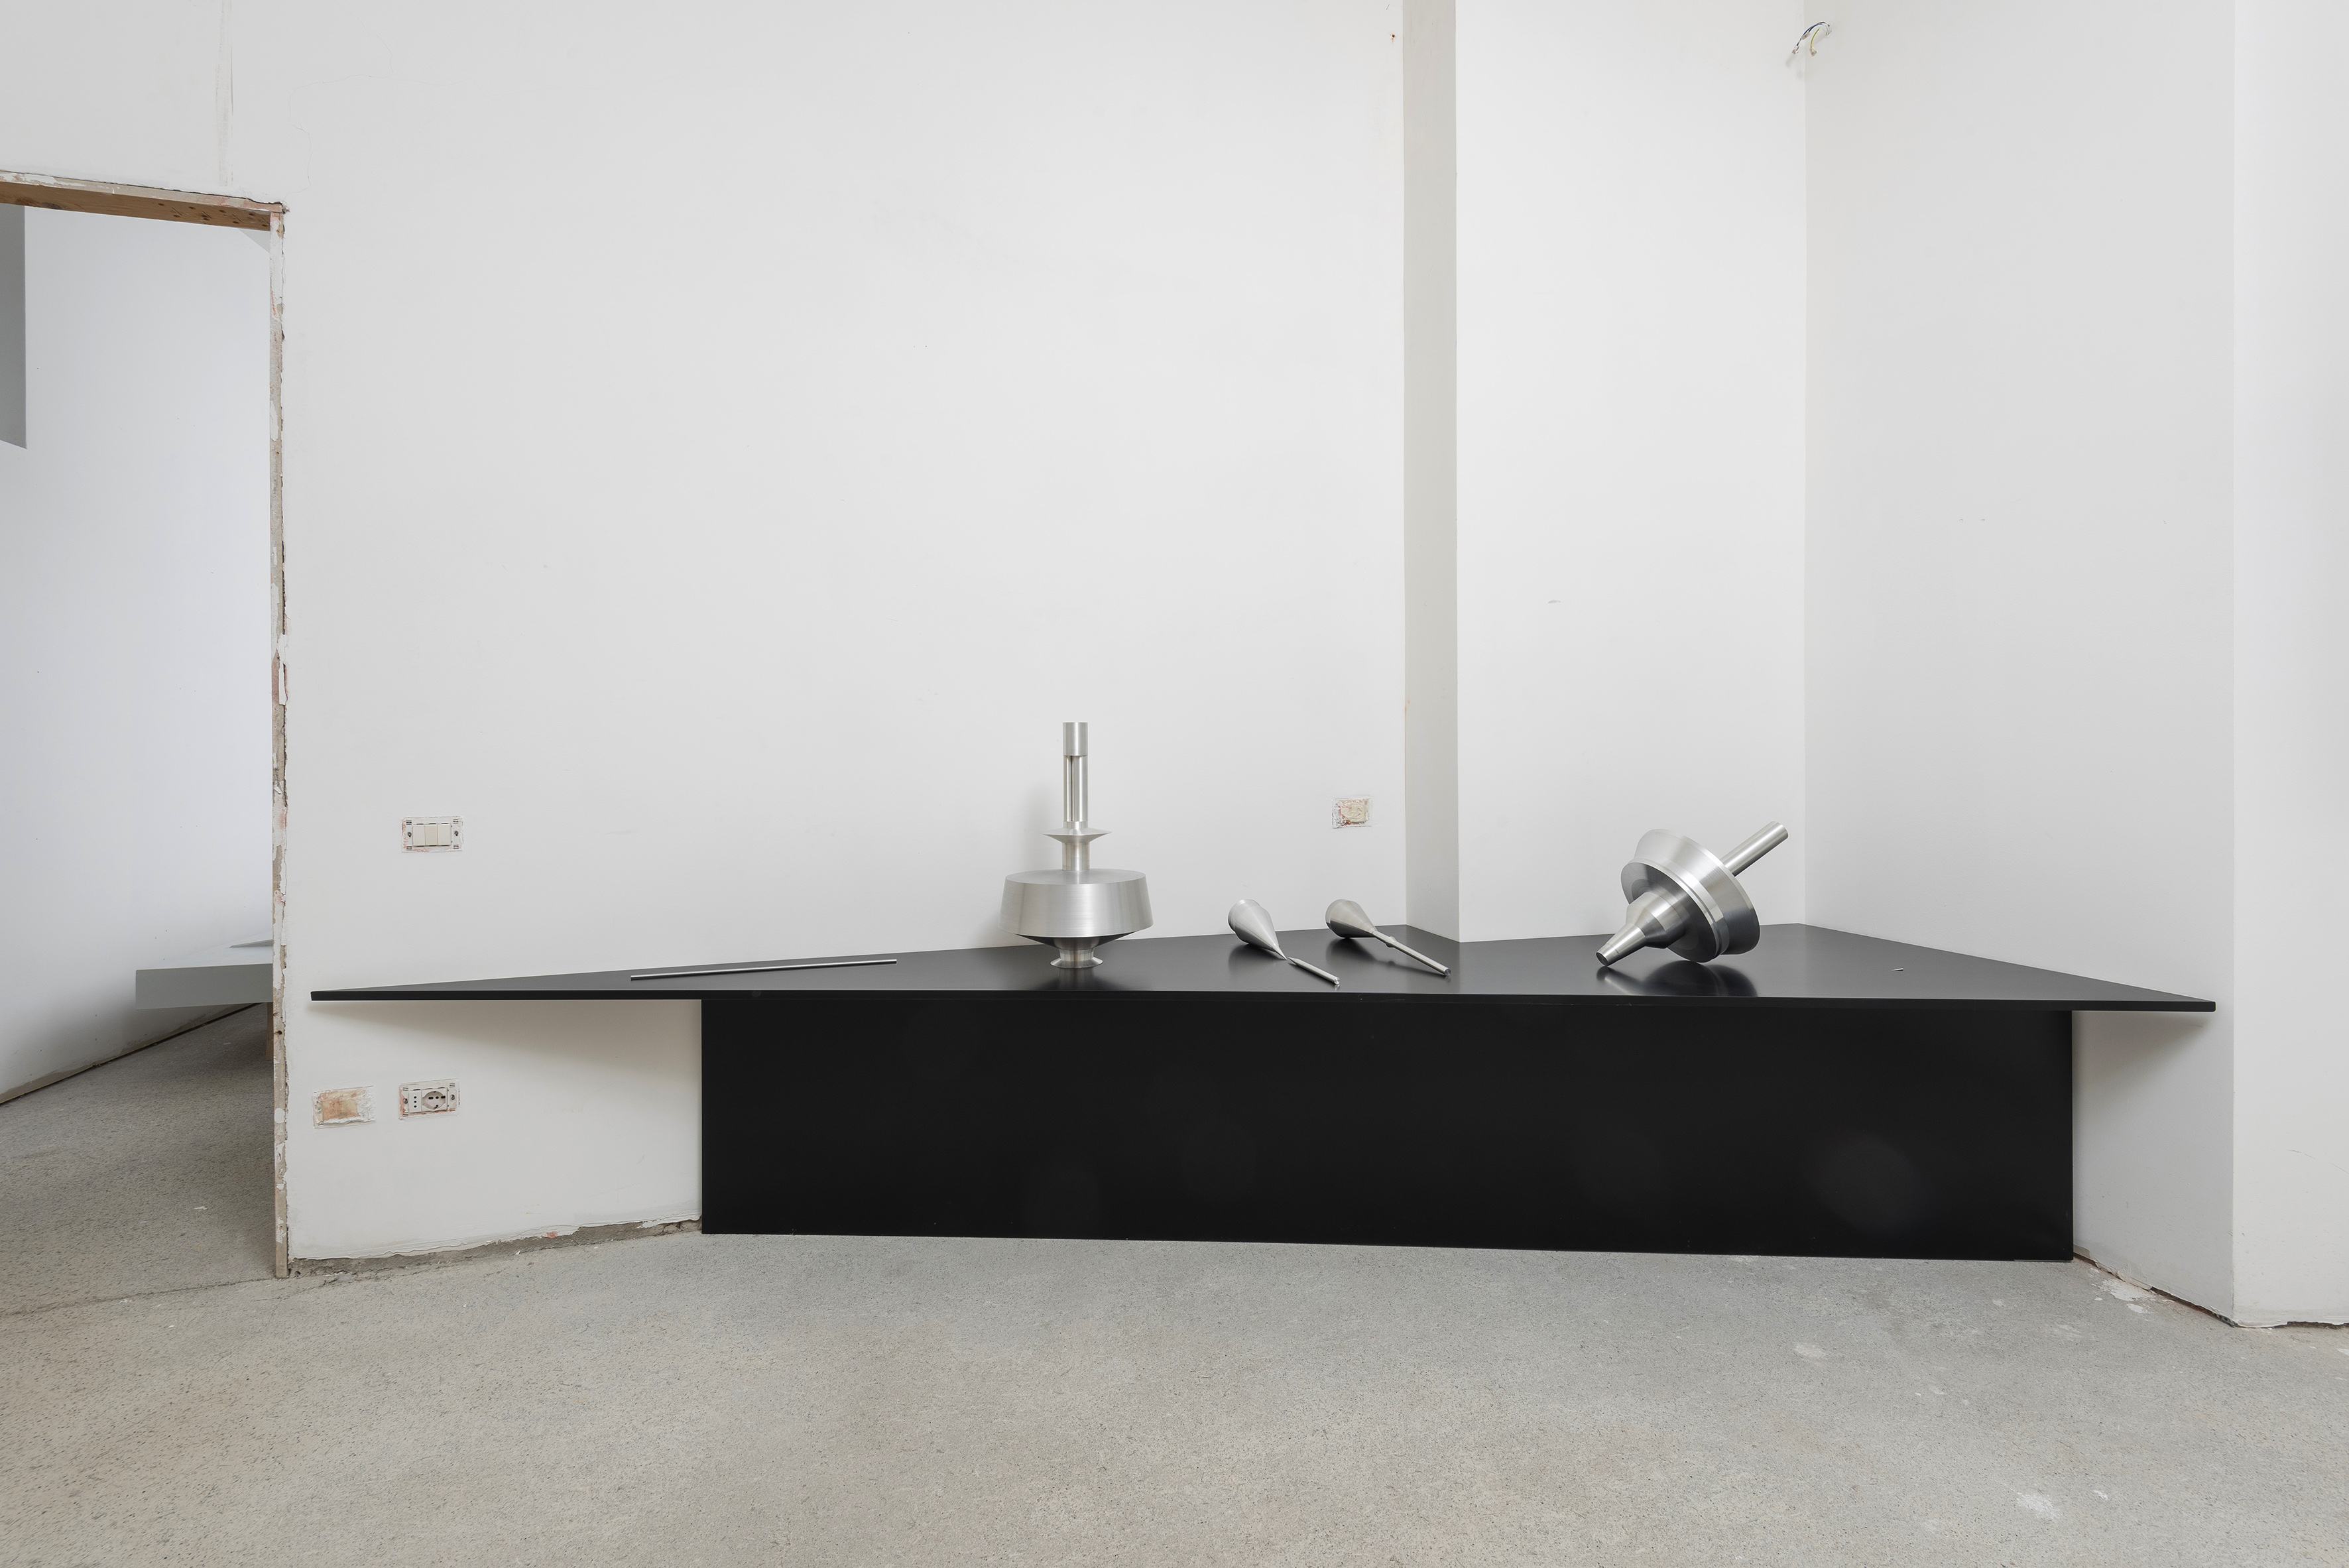
Silvia Hell (Detail) – Markgraf II / Italy / Vatican City State / A Form of History – 2011–2013 – aluminum – (Courtesy Maria Rovero)
4/5
Silvia Hell – Markgraf II / Austria / Switzerland / Germany / Italy / Vatican City State / Hungary / A Form of History – 2011–2013 – aluminum – various dimensions – (Courtesy by the artist, Maria
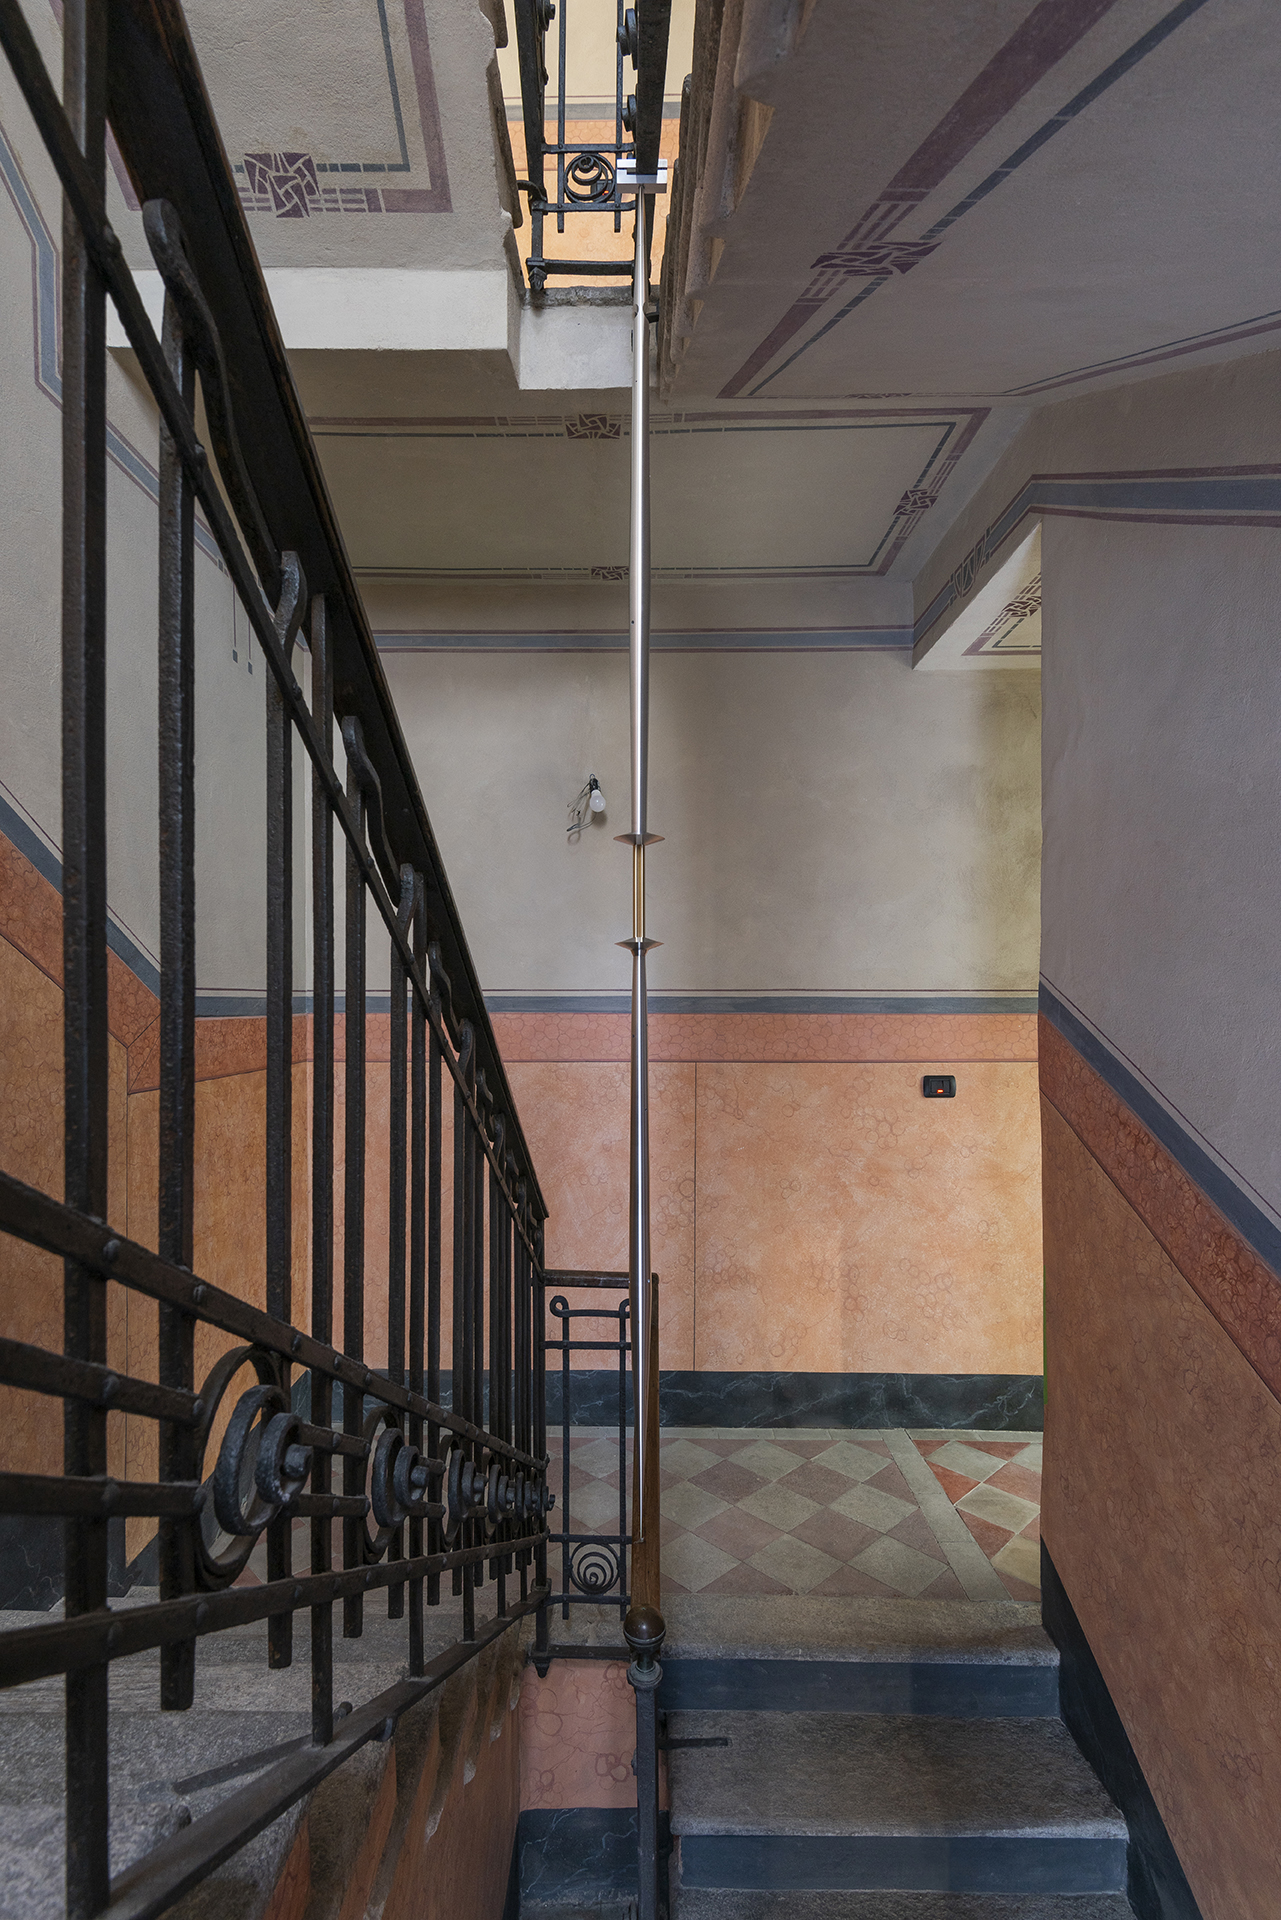
5/5
Scale of uncertainty_uncertain balance_Modern phonetics initially focused on the analysis of γράμματα by means of articulation, dividing between labial, dental, palatal, velar, labiovelar, laryngeal etc., with such descriptive precision that a phonetician who was also a doctor wrote that if the subject in question truly articulated a certain laryngeal sound in the manner described in phonics literature, it would cause his death by suffocation – 2019 – aluminium and brass – 207.2 x 8 x 8 cm
Scored Air
The Air series was designed to quantitatively trace the polluting substances found in the air in Milan. Just like any European text, the data, time and decades are read from left to right: along this vector, Silvia Hell has established five air quality bands on the basis of the values provided by Directive 2008/50/EC of the European Parliament and of the Council of May 21st 2008. The perforated piano roll paper is therefore a record that superimposes the original automatic classical music function with the power to reinterpret the data on air pollution that is printed on its surface: the same air that passed through those holes in the early twentieth century, reproducing the actions of an absent pianist. The absence of a human executor and the overlapping of univocally legible codes to make them repplicable brings together two different systems of interpretation and two reproductions of documentary sources in a single vehicle.
What was the motivation and driving force behind Air?
I have been working with air since January 2018. But I have long felt the need to tackle our growing intolerance to the city air, and my studies on air are my response to this sensation. I have lived in this city since starting the Academy in 2002, but I grew up in large open spaces. One day, as I left Milan for a visit home, I remember feeling deeply moved, just the smell of grass made me want to cry. It was then that I had to face up to the fact that there was something very wrong with my life in the city. So, I read the European directives on air quality, translated into all the languages of the member states. All my systematic research is based on sources that are accessible to everybody, yet people often don’t read them because the language used is so technical that they can at first seem inaccessible to the non-expert.
What were the overall objectives of this systematisation and how did it develop?
The legislation sounded so rigid and detached to my ears that it was decidedly unengaging. It literally didn’t affect my sensitivity to the issue in any way. So, I started singing the words, despite never having sung legal texts before, only literary passages. I started with the legislation in English because I thought it had an additional, looser sound than the Italian (which I know too well). My aim was to learn the clauses by using a more profound emotional approach as opposed to a rational one. I sang the legislation to a blues tune and it lasted almost three hours in total. It’s a very long document. I recorded it and I would listen back to it when I cycled anywhere. Those phrases started to resonate with me in some way, I began to remember them, not completely or continuatively by any means, but as passages and fragments. It was important to preserve traces or combinations of what I was learning. For example, the tone of a word might be expressed differently because the music at that moment suggested a certain emphasis or timbre.
Was the final result of this project immedi- ately clear to you?
Rationally speaking, I had no intention of working with data again on this project as it felt too cold and detached in com- parison with my inner turmoil. I wanted to use a different approach. Even though the fixed format of diagrams representing data is much more than an infographic for me. As I listened back to my record- ings, I noted a formula that occurred repeatedly. There was a phrase that kept coming up: all data and measurements must be made publicly available to enable free access.
Air took inspiration from this freedom of access to the data and the extreme simplicity with which anybody could find information about the state of the air they breathe and, therefore, the life they are living. Each region is obliged to monitor its air and save the data in an archive. Whenever creating a synthesis or image of collected data, it is vital to
be able to make decisions, to translate and interpret. For example, you have to analyze parallel documents and trace an exact period of time to offer a forecast of the future: one imminent deadline is that by 2020, some of the harmful substances found in the air and shown in this data will have to fall within certain parameters for the good of public health. These are the substances that I tracked.
How did the Air project change as you interpreted and reproduced the data?
In just five minutes, I received an email with a list of data gathered hour by hour and day by day that established the levels of the various substances I was investigat- ing every year. In the grid that I created, every millimeter corresponds to a day, in which seven substances are denoted by seven colors and positioned in the air quality band corresponding to the daily average. I knew from the beginning that I wanted to render the elements I found visually. I originally imagined the transferral of data from song to paper as a three-dimensional aluminium structure, with the data printed on narrow steps similar to a keyboard. Visually, it would have been the size of a pentagram. But then somebody mentioned that the shapes of the graphs resembled perforated piano rolls and so I decided to use those instead. The relationship of interest from an artistic perspective often lies in that connection between two different worlds that somehow reside in one other and can be read as one.
1/5
Silvia Hell – Air Milano Rossini – 2018 – UV flatbed print on piano roll, framed – Courtesy Gallery A B
2/5
Silvia Hell – Air Milano Rossini – 2018 – UV flatbed print on piano roll, framed – Courtesy Gallery A B
3/5
Silvia Hell (Detail) – Markgraf II / Italy / Vatican City State / A Form of History – 2011–2013 – aluminum – (Courtesy Maria Rovero)
4/5
Silvia Hell – Markgraf II / Austria / Switzerland / Germany / Italy / Vatican City State / Hungary / A Form of History – 2011–2013 – aluminum – various dimensions – (Courtesy by the artist, Maria
5/5
Scale of uncertainty_uncertain balance_Modern phonetics initially focused on the analysis of γράμματα by means of articulation, dividing between labial, dental, palatal, velar, labiovelar, laryngeal etc., with such descriptive precision that a phonetician who was also a doctor wrote that if the subject in question truly articulated a certain laryngeal sound in the manner described in phonics literature, it would cause his death by suffocation – 2019 – aluminium and brass – 207.2 x 8 x 8 cm